The National Federation of Small Business and Gallup have recently published results of small business surveys, which are consistent with other data which are presented below.
The recent trend has worsened according to several different sources. Conditions had never improved to levels seen in prior business expansions, but the recently-reported sales and profits data have slipped again to recessionary levels that were seen for the first time in years early in the 2008, when the Great Recession was just getting going but was not known to be a recession at all.
This is not an exhaustive set of data for the entire economy, of course. It is, however, consistent with the recent downtrend in corporate profit growth reported by public companies.
The latest survey of its members by NFIB reports worsening of the more than year-long downtrend in profits and sales, though the statistical significance of the data is unclear (LINK). Here are some results (more easily seen on the linked document, p.9):
ACTUAL SALES CHANGES
Net Percent (“Higher” Minus “Lower”) Last Three Months
Compared to Prior Three Months
(Seasonally Adjusted)
SALES
Actual (Prior Three Months) and Expected (Next Three Months)
January 2007 to November 2012
(Seasonally Adjusted)
Jan Feb Mar Apr May Jun Jul Aug Sep Oct Nov Dec
2007 -3 -1 0 4 1 -4 -1 -4 -4 -4 -3 1
2008 -7 -8 -11 -9 -11 -12 -15 -10 -11 -21 -25 -29
2009 -31 -28 -34 -28 -33 -34 -34 -27 -26 -31 -31 -25
2010 -26 -26 -25 -15 -11 -15 -16 -16 -17 -13 -15 -16
2011 -11 -11 -12 -5 -9 -7 -8 -9 -10 -12 -11 -7
2012 -6 -7 1 4 2 -5 -9 -13 -13 -15 -15
Sales trends were weakening in 2007 and by mid-2008, well into the not-yet-Great recession, were at current levels. No recovery to positive territory ever occurred. Initially such astute analysts as Bill McBride of Calculated Risk took the optimistic view that because NFIB’s members were somewhat overweighted in the construction trade, the actual results understated the strength of small business in the economy as a whole. Now that construction has made “the turn”, however, no such explanation is possible. For the past four months, the survey shows sales trends is back to levels of sales declines not seen since 2010.
The profit trends are also poor (2012 only shown here; full data on p. 8):
ACTUAL EARNINGS CHANGES
Net Percent (“Higher” Minus “Lower”) Last Three Months
Compared to Prior Three Months
(Seasonally Adjusted)
2012 -24 -19 -23 -12 -15 -22 -27 -28 -27 -26 -32
The -32 for November is a three-month average. Thus the actual November number was about -42, because the prior four months were stable around -27. Now, the NFIB November survey is not large, most responses are not usable for unknown reasons, so whether this sudden deterioration is profits can be extrapolated widely is unclear. (Note that NFIB did not find any particular effect from Sandy in this survey.)
Gallup shows similar results, as it published the following on Dec. 6 (LINK):
U.S. Small-Business Owners’ Hiring Intentions Plunge
U.S. small-business owners expect to add fewer net new jobs over the next 12 months than at any time since the depths of the 2008-2009 recession, according to this November’s Wells Fargo/Gallup Small Business Survey. Small-business owners’ net hiring intentions for the next 12 months plunged to -4 in November, down from +10 in July and matching the previous record low recorded by the Wells Fargo/Small Business Index of -4 in November 2008.

Gallup picked up similar trends in another survey (LINK):
December 13, 2012U.S. Small-Business Owners Pull Back Capital Spending Plans
Net capital spending over the past 12 months declined to -22, down from -11 in July
by Dennis Jacobe, Chief Economist
PRINCETON, NJ — U.S. small-business owners’ net capital spending intentions for the next 12 months plunged to -14 in November, the lowest level in more than two years, according to the Wells Fargo/Gallup Small Business Index. This is down from net capital spending intentions of -1 in July and suggests the nation’s small-business owners are likely to pull back on their business investments even more, given their negative expectations for the next 12 months.
Gallup has also picked up similar trends in the broader economy (LINK):
U.S. Unadjusted Unemployment Shoots Back Up

Gallup questioned whether the above jump up was related to Sandy, or whether the prior spike down to new recovery low levels (low being good, of course, in this case). The following suggests the latter may be the more correct explanation, given this poll (LINK):
U.S. Payroll to Population Rate Falls to 43.7% in November
Payroll to Population declines across all regions
by Jenny Marlar
WASHINGTON, D.C. — The U.S. Payroll to Population employment rate (P2P), as measured by Gallup, was 43.7% for the month of November, down from 45.7% in October. This is the largest month-over-month decline in P2P since Gallup began tracking it in January 2010.

That the decline in P2P was seen in all regions may be important.
The above trends are also the gigantic Federal “JOLTS” survey, where a rebound in hiring has only reached the levels seen in prior economic cycle bottoms (and despite a larger population now):

(Courtesy Calculated Risk (LINK)
It looks to me as if the above trends are consistent with the rolling-over phenomenon that began in or around 2006 before the actual jobs recession took hold.
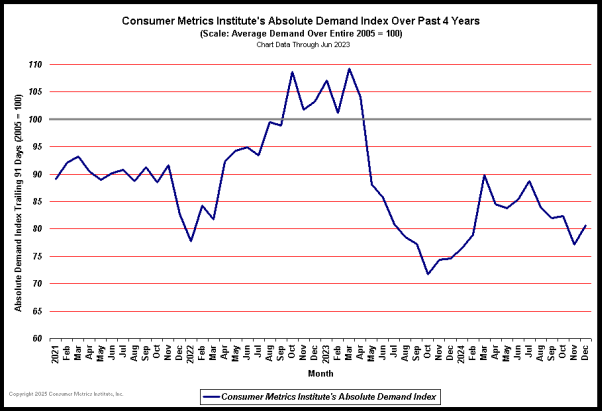
In addition, our friend Rick Davis of Consumer Metrics is gathering data that is also consistent with an acceleration of the U.S. economy to the downside (LINK). In the past, surges in this index up and down have been good leading indicators of the stock market. For example, it turned up sharply in the summer of 2011 as the stock market was declining, and also turned up sharply in the fall of 2008 when it appeared as though the economic world was ending.
His growth rate index is also showing poor recent results but good 12-month results, which is often a bad sign for the stock market, as year-on-year comparisons are still good, thus encouraging optimism:
Trailing 91, 183 and 365 Day Data
| Trailing Days: | 91-Day | 183-Day | 365-Day |
| % Growth(4): | -4.33% | -1.04% | 6.66% |
| Percentiles(5): | 3.17% | 9.98% | 88.80% |
The futures markets show some extreme bullish bets by traders on the S&P 500 index (e-mini contract), silver, palladium– and Treasury bonds.
There is more than the usual amount of uncertainty now amongst both investors/speculators and economists, considering unsettled events in Washington, how much the recent data has been affected by Hurricane Sandy, the evolving euro-zone economic and political difficulties, etc.
Nonetheless, a growing number of data points support a cautious view of the current situation of, and short-term prospects for, economic activity in the United States.


